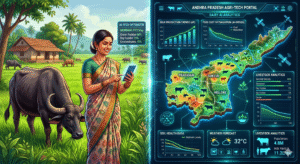
From Fields to Feed: How AI can solve ’s Livestock Nutrition Crisis
An intelligence platform to forecast feed demand, map supply across 26 districts, and put least-cost rations in every farmer’s hands — built to ICAR standards for the Animal Husbandry, Dairy Development & Fisheries Department of Andhra Pradesh.
A Hidden Crisis in Livestock Nutrition
The Animal Husbandry, Dairy Development & Fisheries Department framed the challenge clearly. Across the state’s districts:
- Farmers overspend on feed because rations aren’t scientifically balanced.
- Feed resources are unevenly distributed — one district sits on a surplus of crop residue while another runs a deficit.
- Decision-makers have no single, data-driven view connecting livestock numbers, crop output, agricultural by-products, and weather.
- There was no AI system capable of forecasting feed demand and supply or recommending the cheapest viable feed mix for a farmer.
The result: higher costs, poorer animal health, lost income for farmers, and policy decisions made without the data to back them. The department’s ask was ambitious: build an AI platform that estimates district-level feed requirements and resources to ICAR standards, and puts least-cost feed formulation in the hands of farmers.
Turning Scattered Data into Decisions
The hardest part of this problem isn’t the AI — it’s the data. Livestock, crops, by-products, land use, and weather live in completely different datasets, measured in different units, collected on different cycles. Our first job was integration and normalization.
We unified the state’s data into a single decision-making layer covering:
Critically, we also integrated district-level land use classification data — one of the most consequential inputs for estimating realistic feed availability on the ground:
Cultivated Land
Primary source of crop residues, fodder crops, and agricultural by-products used in ration formulation.
Forest Land
Contributes tree fodder and browse material available to grazing livestock, especially in tribal and hilly districts.
Fallow & Grassland
Seasonal grazing land with variable carrying capacity, accounted for by season and recent rainfall.
Barren / Wasteland
Identified as zero-contribution zones, preventing inflated supply estimates in data-scarce areas.
Waterlogged Land
Mapped as a key driver of localised supply deficits in flood-prone mandals where crops and fodder are inaccessible.
Pasture & Common Land
Community grazing areas factored into calculations, particularly for small ruminants and poultry-keeping households.
By layering land use data against crop output and rainfall, the platform avoids the common pitfall of overestimating feed supply. A district may appear crop-rich on paper — but if significant portions of its land are barren, waterlogged, or non-cultivable, actual available feed is far lower. This classification layer ensures every supply estimate reflects what farmers can realistically access.
In total, the system reasons over roughly 18,800 structured records, cross-joining them in real time across districts, mandals, animals, land types, and seasons. The complexity isn’t in the raw size — it’s in the combinatorial work of turning all of it into one trustworthy answer: does this region have enough feed, and if not, what should be done?
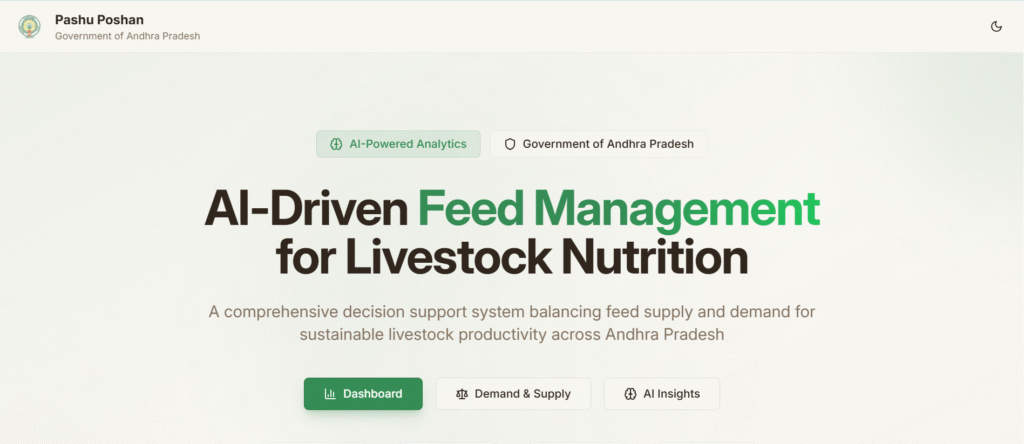
The Pashu Poshan Intelligence Platform
We built a full-stack, government-grade dashboard with three pillars that map directly to the department’s expected outcomes.
AI-Powered Feed Demand Estimation
Using livestock census data and ICAR nutritional models (Model-A through Model-D/E for different animal types), the platform calculates exactly how much green fodder, dry fodder, concentrate, protein, and energy each district and mandal requires. Demand is computed at breed level, not lumped averages — so a district heavy in dairy buffalo is treated differently from one dominated by small ruminants.
AI-Enabled Feed Supply Estimation
The platform translates crop and fodder production into actual feed availability using scientific crop-to-feed conversion ratios (grain:straw, oil-cakes, ethanol by-products). Supply is weather-adjusted using an inverted-U response curve that correctly penalises both drought and flooding. Land use classification is integral here: waterlogged and barren land is excluded from supply calculations, while forest, fallow, and pasture land contributes proportionate browse and grazing estimates. Supply is broken down by season (Kharif, Rabi, annual, and perennial) so planners can anticipate shortfalls before they happen.
AI-Assisted Least-Cost Feed Formulation
For the farmer-facing outcome, we built an optimisation tool that recommends the cheapest feed mix meeting nutritional requirements, using locally available ingredients and live market prices. This is where cost savings become concrete — balanced rations at the lowest viable price, tailored to what’s actually accessible in that mandal.
From Analysis to Decisions
On top of these pillars, we layered features that turn analysis into action for officers and planners. A Demand vs Supply view with district- and mandal-level risk analysis shows surpluses and deficits as colour-coded risk badges so officers can spot trouble at a glance. An interactive rainfall simulator lets planners drag a slider from drought to flood and watch feed supply and risk respond in real time — a “what-if” tool for proactive intervention.
The AI Intelligence Centre uses large language models to generate context-specific insights: the primary bottleneck limiting a district, root-cause analysis, multi-year forecasts, and concrete policy recommendations — always with a deterministic rule-based fallback so the system never goes dark.
Transparency is built in throughout. Every figure is traceable to its data source and the ICAR model behind it, with documented assumptions and limitations. For a government tool, trust isn’t optional.
Turning supply-demand data into predictive insights for proactive decisions
The solution empowers effective decision making:
District-level visibility of feed surpluses and deficits, enabling intervention before a shortage becomes a crisis.
Lower feed costs and healthier animals through scientifically balanced, least-cost rations.
Data-driven policy planning grounded in livestock, agricultural, land use, and climate data — not anecdote.
A foundation for a sustainable livestock nutrition ecosystem that supports food security and farmer income across the state.
Good Engineering, Quiet Impact
This project is a blueprint for what AI for public good actually looks like. It isn’t a flashy model in search of a problem — it’s the unglamorous, high-impact work of integrating messy real-world data, encoding scientific standards faithfully, and presenting the result so clearly that a district officer can act on it in seconds.
For the farmer, it means a few rupees saved on every feeding and a healthier herd. For the department, it means policy backed by evidence. For the state, it means a more resilient, food-secure livestock economy.
That’s the kind of problem we love to solve: where good engineering quietly improves thousands of livelihoods.
Interested in solving problems like this?
If your organisation has fragmented data and decisions that deserve better, let’s talk about what AI can do for you.